Metrics & Guardrails
Metrics
DORA Metrics
DORA metrics are the current standard in tracking the velocity and quality of deployments. The main challenge today is that there are many different data points (like when a Git commit is made, or when an incident starts/finishes) which have to be aggregated, each of which comes from a different data source. It is also difficult to get DORA metrics at varying levels of granularity (team, org, company) without a lot of additional deployment plumbing, which in turn makes it harder to identify true developer productivity.
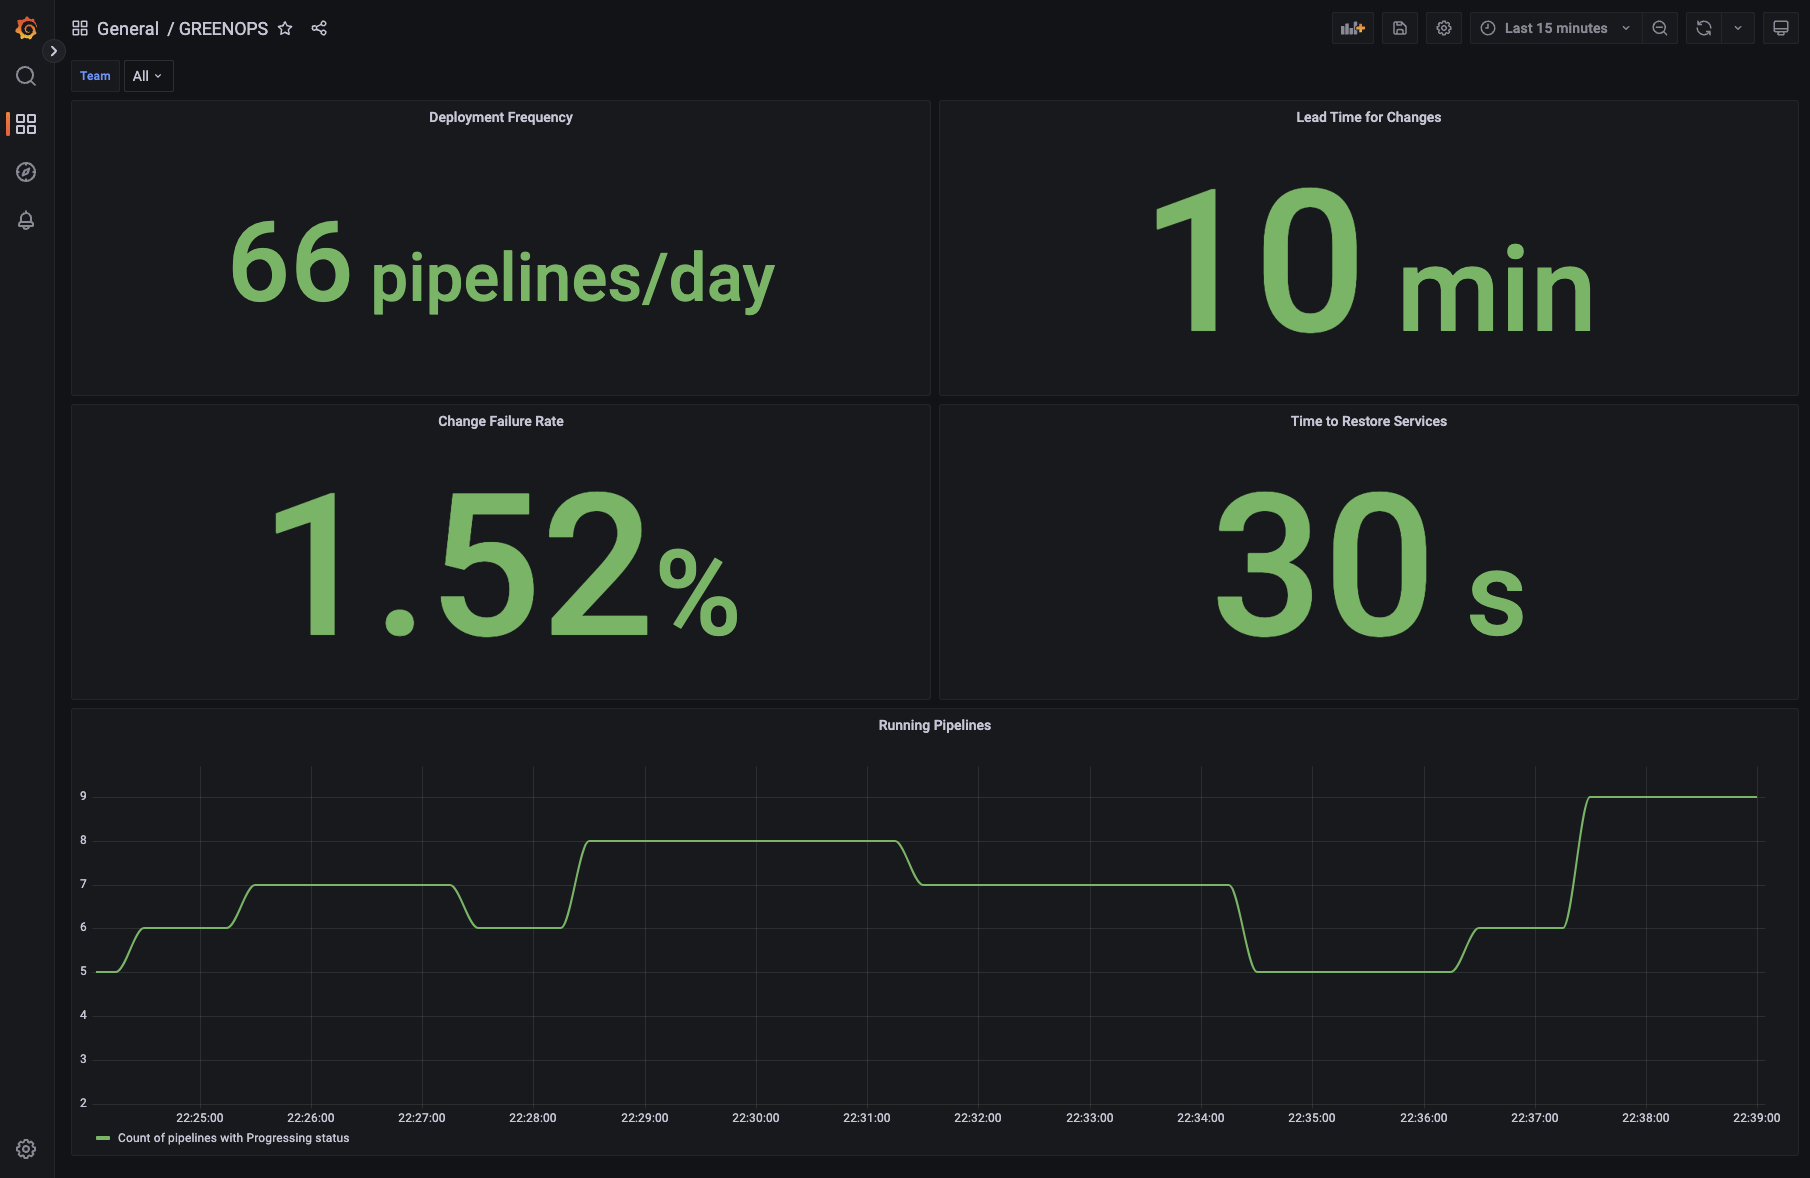
GreenOps provides built-in deployment plumbing for metrics. GreenOps does all of the data aggregation mentioned above under the hood and exports the core four DORA metrics, making it very simple to create and modify productivity dashboards without a tedious lead-up process. GreenOps also exports this data at different levels of granularity, allowing DORA metrics to be visualized at an org and team level.
Here is an example of a dashboard created from GreenOps' exported DORA metrics:
Custom Metrics
Both DevOps teams and developer teams generally want to be able to add custom metrics as a part of the deployment process. This could be in the form of exporting a metric after finishing a specific step in a CI/CD pipeline, or exporting a ML model accuracy after a training step.
With GreenOps, metrics add-ons are simple. Metrics can be registered in GreenOps and then assigned to specific pipelines or steps, where the manifests will automatically be updated with the injected metric before it is run. This will centralize all metrics operations and reduce all the management overhead involved with keeping track of custom metrics.
Shift-Left Visibility
CI/CD pipelines have a lot of steps that encompass a lot of different tools. One of the most important parts of a CI/CD pipeline is to analyze which steps are acting as bottlenecks and are the least performant, and which pieces are working the best. The benefits of this are clear - it helps to improve the developer experience, reduce problems with the developer process, and make it easier for DevOps teams to enhance deployment operations.
GreenOps exports duration and failure Prometheus metrics for each step across all pipelines and provides Grafana dashboard templates, providing out of the box analytics into which components of CI/CD pipelines are bottlenecks.
Guardrails
Coming Soon
It is a challenge to continuously check that deployment pipelines are configured correctly, deployment steps are being used correctly, and that applications are going to the correct environments. The main concern is that misconfigured pipelines or misconfigured environments could negatively affect deployment state and cause downtime.
GreenOps alleviates these constant manual checks & overhead by providing automated, fine grained policy management for deployment pipelines and environment state.